Sectors / Markets
Markets
WEEKLY MARKET PRICE MONITORING
FSNAU and FEWS NET jointly monitor 71 markets (46 urban and 25 rural) across Somalia on a weekly basis. The data is processed and monthly averages are accessible at https://www.fsnau.org/ids/index.php. Monthly Market Updates which provide analysis of monthly market prices and trends are published at https://www.fsnau.org/publications
In addition, a snapshot analysis of Weekly Market Prices for selected main markets across Somalia is provided in the links below:
Download weekly market prices - Week 2 of November 2020
Download weekly market prices - Week 1 of November 2020
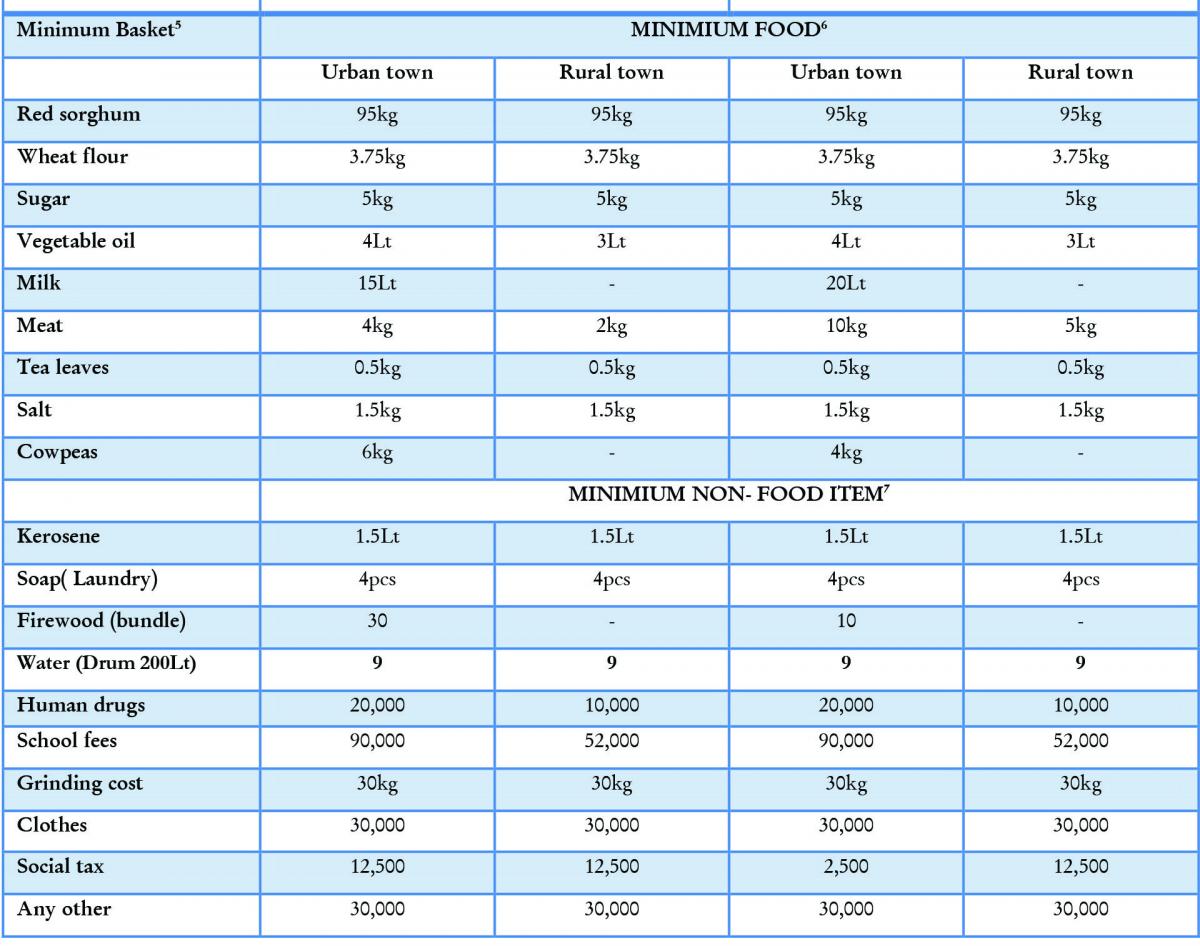
COST OF MINIMUM EXPENDITURE BASKET (CMB)
FSNAU developed a minimum expenditure basket (MEB), consisting of minimum quantities of essential and basic food and non-food items. The MEB represents minimum set of BASIC food items such as sorghum, vegetable oil and sugar, comprising 2,100 kilocalories/person/day basic energy requirement for a household of 6–7 and non-food items such as such as water, kerosene, firewood, soap and cereal grinding costs. The MEB contains 4 sub-baskets; 2 baskets cover the rural and urban towns in the North West (Somaliland shillings) and the other 2 cover the rural and urban towns in the rest of the country (Somali Shillings).
Analysis
Once the prices have been collected, entered into the e-forms and sent to Nairobi and imported into the IDSS, they are carefully examined for consistency and validity before they are entered into the CPI calculations template. The CMB is calculated and tracked on a monthly/ quarterly basis and the changes compared to the reference year (March 2007), the same month the previous year (year on year), quarterly and month on month variations. It is one of the indicators that we use in the quarterly urban food security analysis . For every town, the Individual item basket Prices are multiplied by their corresponding Minimum Basket quantities. The Minimum Basket Cost for each town are then summed up to obtain the MEB. Higher level aggregation is then done for zone/ region using pivot table in Excel.
After technical engagement with partners, FSNAU have also generated Cash based Intervention Cost of Minimum Basket for urban/main markets. Download the analysis results through the links below:
CONSUMER PRICE INDEX (CPI)
The CPI is calculated as the average percentage change in the current MEB Cost in reference to the March 2007 MEB Cost. As prices vary, the total cost of the basket also varies and thus the CPI measures the change in the cost of this basket. It provides a way to compare what this basket costs at a given period relative to a reference or base period. In our case, The March 2007 CPI from all markets (consequently all regions and Zones) set at 100% and the costs in other periods are expressed as percentage changes compared to the base period. Weighted Laspeyres Price Index methodology is applied in the computation.
The CPI is aggregated upwards from individual markets (towns) and represented by Zone (South, Central, North Somali Shillings (NE), North Somaliland Shillings (NW)).
Interpretation
If for instance the Consumer Price Index (CPI) in a given zone (say Central) a year ago was 180 and it is currently 267 points, then the minimium cost of living is said to have increased by 48 percent in that zone. In other words, it costs 87 currency units more to purchase the same basket of goods and services in the current month compared to the same period the previous year. This means that on average, goods and services in the MEB cost 1.48 times as much as they did for the same basket of goods and services a year ago. A significant increase in the CPI is largely attributed to increases in cereal prices (sorghum/ rice) as they constitute the largest proportion (30%–60%) of the MEB. The analysis of food price index can therefore help identify food insecure regions and suggest some form of prioritization of policy and program response.
Download the Full CMB/CPI Report (PDF, 294KB)